 |
| http://www.google.com/imgres?q=park+map&hl=en&gbv=2&addh=36&tbm=isch&tbnid=qygFCZ80FQwlGM:&imgrefurl=http://www.meetup.com/Chicago-Digital-Photo/files/&docid=ZSF6YyqwwMb0NM&w=583&h=454&ei=YopeToT-LuLkiALsz7SzBQ&zoom=1&iact=rc&page=2&tbnh=140&tbnw=198&start=27&ndsp=29&ved=1t:429,r:24,s:27&tx=80&ty=54&biw=1920&bih=1079 I chose this map because it looks more like drawn animated. The map depicts itself as a recreational park center. Also the data that presents has polygons, rather than just lines and dots. Not the mention that there is only lines (roads) and the dots are named places like that fountain, plaza, or garden. There is a slight difference from the other two maps, this map has like a 2-dimensional structure. |
Wednesday, August 31, 2011
Geog Lab 1 Map-3
Geog Lab 1 Map-2
 |
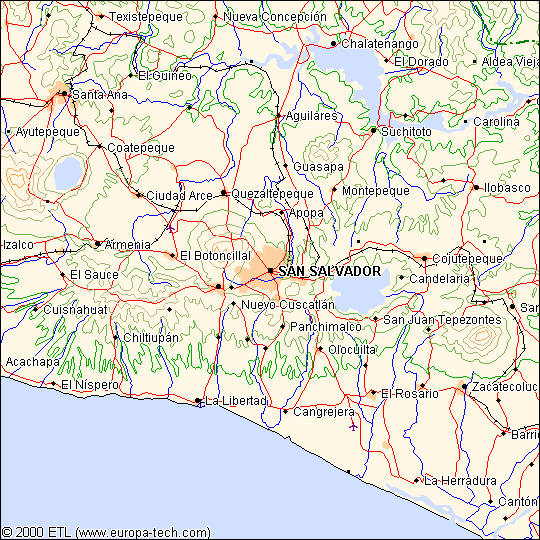
| http://salvaspan.homestead.com/files/la_libertad.jpg Even though its kind of a fast map and small, it looks plain. The Mid-West of El Salvador C.A. mostly urbanize and highly populated cities shown in peach color. Notice that the color is known for what it is, obvious blue for rivers, green for plains while they rise to high altitude terrain, red for major transits, and black for railroad tracks. Upon the data mostly lines and dots, but not much polygon depiction. |
Geog Lab 1 Map-1
 |
| http://www.virgin-islands-on-line.com/st/st-thomas-map.shtml The St. Thomas (US) island map depicts routes, banking services, tourist centers, and snapshot moments. For the routes, notice that they have a distinct different color, its because the touring aspect of each route that is has different attraction to experience from it. The map shows how gas stations and especially banks/atm are at every 1/2 mile or 1 mile for tourist. Other than dots and lines for data, there were no river lines for this island map. |
Subscribe to:
Comments (Atom)